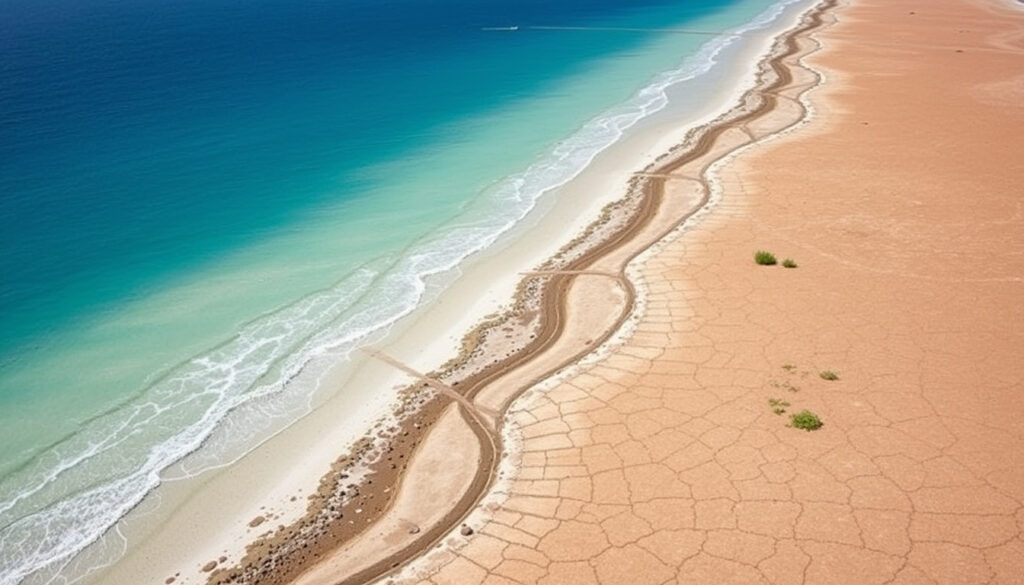
Sea Salinity: Ocean Salinity, Soil Salinity & Management
Pour a glass of seawater and it looks like any other water, yet roughly 3.5 percent of its weight is dissolved salt (NOAA National Ocean Service, U.S. ocean agency) — a chemistry that drives ocean currents, shapes marine life, and separates drinkable water from water that can ruin a crop. Understanding sea salinity means knowing how it is measured, which seas are saltiest, and why the same salt that flavors the ocean can quietly degrade farmland.
Average ocean salinity: 35 parts per thousand (‰), or 35 grams per kilogram · Highest surface salinity: Atlantic Ocean, ~36.5‰ · Dead Sea salinity: ~340‰, up to 10× the ocean average · Drinkable water threshold: below 500 mg/L total dissolved solids (≈0.5‰) · Salinity unit: practical salinity unit (PSU) or ‰ · Major dissolved salt: sodium chloride, ~85% of total salts
Quick snapshot
- The Atlantic Ocean has the highest average surface salinity among the major oceans, around 36.5‰ (NOAA National Ocean Service, U.S. ocean agency).
- The Dead Sea is hyper-saline at roughly 340‰, about 10 times the open-ocean average (FAO Water Quality for Agriculture, UN guidance).
- Most crops grow best in soil below 2 dS/m, the range Utah State University Extension classifies as nonsaline (Utah State University Extension, agricultural research unit).
- PSU values are conductivity-based and dimensionless, not a direct measurement of salt mass — a distinction the FAO Soils Portal (UN food and agriculture agency) flags.
- Salt-affected soils split into saline, saline-sodic, and sodic classes, so “salty soil” alone does not define the problem (Utah State University Extension, agricultural research unit).
- Sea-ice formation makes surrounding seawater saltier as salt is excluded from the ice, and the melt season reverses that (NOAA National Ocean Service, U.S. ocean agency).
- These seasonal density shifts feed the thermohaline circulation that moves heat around the planet (NOAA National Ocean Service, U.S. ocean agency).
- Salt control on farms depends on pairing leaching with drainage, so salts leave the root zone for good (FAO Water Quality for Agriculture, UN guidance).
- Test soil EC before planting: values above 8 dS/m are already “generally unsuitable for crops” in the Utah State University Extension classification (Utah State University Extension, agricultural research unit).
Five numbers, one pattern: open-ocean readings cluster near 35‰, enclosed seas swing to extremes, and farmland operates on a completely different, far smaller scale.
| Metric | Reading | Reference source |
|---|---|---|
| Average ocean salinity | 35‰ (35 grams per kilogram) | NOAA National Ocean Service (U.S. ocean agency) |
| Highest ocean surface salinity | Atlantic Ocean, ~36.5‰ | NOAA National Ocean Service (U.S. ocean agency) |
| Dead Sea salinity | Approximately 340‰ | FAO Water Quality for Agriculture (UN guidance) |
| Drinkable water limit | < 500 mg/L TDS (≈0.5‰) | FAO Water Quality for Agriculture (UN guidance) |
| Most salt-tolerant crop | Barley (up to 10–12 dS/m) | Utah State University Extension (agricultural research unit) |
| Major dissolved salt | Sodium chloride (~85% of total salts) | FAO Water Quality for Agriculture (UN guidance) |
What is salinity?
Salinity is the total amount of dissolved salts in water, and in the ocean that mix is dominated by sodium chloride. No single probe weighs the salt directly; every method measures something related — conductivity, evaporation residue, or light refraction — and converts it to a salinity value.
How is salinity measured?
- Oceanographers measure conductivity, because dissolved salts make seawater a better electrical conductor; PSU values come from that indirect reading, according to the FAO Soils Portal (UN food and agriculture agency).
- Soil scientists use the same conductivity principle on a water extract taken from the ground and report results in deciSiemens per meter (dS/m) (Utah State University Extension, agricultural research unit).
There is no practical way to weigh the salt in a moving ocean, so indirect methods dominate. The trade-off is that “how salty” depends on which probe and which scale you are reading.
What units are used for salinity?
- ‰ (parts per thousand) — grams of dissolved salt per kilogram of seawater; the classic public-facing unit.
- PSU (practical salinity unit) — a conductivity-based scale, not a direct mass measurement, according to the FAO Soils Portal (UN food and agriculture agency).
- dS/m (deciSiemens per meter) — the standard unit for soil salinity assessment (Utah State University Extension, agricultural research unit).
The two most common mistakes in salinity reporting are treating PSU as a weight measurement and mixing up ocean units with soil units. The difference matters: a soil at 4 dS/m is already “slightly saline” in Utah State University Extension’s classification, while open-ocean seawater holds far more salt than any soil reading.
The pattern: salinity is not one number but a family of measurements, and each answers a different question — about ocean currents, about drinking water, or about the next planting season.
Which ocean has the highest surface salinity?
The Atlantic Ocean takes that title. Its surface runs measurably saltier than the Pacific or Indian Oceans because warm subtropical skies pull water vapor out of the surface faster than rainfall and river inflow replace it.
Salinity of the Atlantic Ocean
- Average surface salinity is about 36.5‰, the highest among the major ocean basins (NOAA National Ocean Service, U.S. ocean agency).
- The subtropical Atlantic is an evaporation-dominated zone: water leaves as vapor, salts stay behind (NOAA National Ocean Service, U.S. ocean agency).
Salinity of the Pacific Ocean
- The Pacific averages about 34.5‰ — lower than the Atlantic, in large part because its precipitation and runoff balance differs across the basin (NOAA National Ocean Service, U.S. ocean agency).
Salinity of the Indian Ocean
- The Indian Ocean shows sharper seasonal swings: monsoon rains pour freshwater over parts of the basin and temporarily dilute the surface, which is exactly the evaporation-precipitation effect NOAA National Ocean Service describes.
Six bodies of water, one pattern: the more enclosed the basin and the hotter the evaporation, the saltier the water — unless rivers dilute it first.
| Body of water | Typical surface salinity | What drives it |
|---|---|---|
| Open ocean (global average) | ~35‰ | Balance of evaporation and precipitation (NOAA National Ocean Service, U.S. ocean agency) |
| Atlantic Ocean | ~36.5‰ | Evaporation exceeds precipitation across much of the subtropics (NOAA National Ocean Service, U.S. ocean agency) |
| Mediterranean Sea | ~38‰ | Semi-enclosed basin where evaporation concentrates salts (NOAA National Ocean Service, U.S. ocean agency) |
| Red Sea | ~40‰ | Hot, arid basin with strong evaporation and little freshwater input (NOAA National Ocean Service, U.S. ocean agency) |
| Baltic Sea | As low as ~7‰ | Large river inflow keeps it brackish (NOAA National Ocean Service, U.S. ocean agency) |
| Dead Sea | ~340‰ | Terminal lake with intense evaporation and no outflow (FAO Water Quality for Agriculture, UN guidance) |
The Atlantic’s extra salt is not a trivia fact. That dense, salty water sinks in the North Atlantic and helps pull the global conveyor belt forward — so a small shift in surface salinity can rearrange heat delivery to entire continents (NOAA National Ocean Service, U.S. ocean agency).
The implication for anyone reading a salinity map: “sea level” is not one number. A crew crossing the Atlantic, a swimmer in the Baltic, and a farmer drawing brackish irrigation water are all looking at completely different salt loads.
What are the factors that influence the salinity of the ocean?
Four main forces move salt into and out of seawater: evaporation, precipitation, freshwater inflow from rivers, and the freezing and melting of sea ice. NOAA National Ocean Service (U.S. ocean agency) groups them under the same logic — remove water and salts concentrate, add water and they dilute (NOAA National Ocean Service, U.S. ocean agency).
Evaporation and precipitation
- Evaporation removes water vapor but leaves dissolved salts behind, so surface salinity climbs in hot, dry zones (NOAA National Ocean Service, U.S. ocean agency).
- Rainfall adds freshwater to the surface layer and lowers salinity; the same happens where large rivers pour into the sea.
Ocean currents and mixing
- Saltier water is denser, and those density differences help drive the thermohaline circulation — the global conveyor belt of deep and surface currents (NOAA National Ocean Service, U.S. ocean agency).
- Currents also redistribute salt between basins, which is why local salinity cannot be predicted from local weather alone.
River runoff and ice melt
- Rivers and meltwater add freshwater, lowering salinity near coasts, estuaries, and ice margins (NOAA National Ocean Service, U.S. ocean agency).
- Sea-ice formation does the reverse: ice excludes salt, so the water around new ice becomes saltier.
The same four forces explain the extremes on a world map. The Atlantic is saltier than the Pacific because its evaporation balance leans that way; the Baltic stays brackish because rivers pour in faster than evaporation can concentrate them.
Why this matters: ocean salinity is a map, not a single value, and scientists treat its shifts as signals of changing rainfall, evaporation, and ice melt across the planet.
What is the major source of sea salinity?
The ocean’s salt came from the land. Over millions of years, rain weathered continental rocks and rivers carried the dissolved ions — mostly sodium and chloride — into the sea, in the same weathering-and-runoff cycle described in FAO guidance on water quality for agriculture.
Chemical weathering of rocks
- Rainfall slowly dissolves minerals in continental rocks, releasing sodium and chloride ions into streams and rivers (FAO Water Quality for Agriculture, UN guidance).
- Rivers then deliver those dissolved salts to the sea, and sodium chloride accounts for roughly 85 percent of the total salts dissolved in seawater (FAO Water Quality for Agriculture, UN guidance).
Hydrothermal vents
- Deep-sea vents release mineral-rich fluids at mid-ocean ridges and add some salts to the ocean.
- Their contribution is minor compared with continental weathering, which remains the dominant long-term salt source.
Atmospheric deposition
- Sea-salt aerosols travel through the atmosphere and return to the ocean in rain, creating a loop that moves salt from sea to land and back.
The takeaway: today’s ocean salt is mostly ancient terrestrial rock, dissolved by rain and carried by rivers — which is why the same water cycle that feeds crops also keeps the sea salty.
What are the different types of salinity?
Salinity appears in several forms, and the labels matter: natural or human-caused, marine or soil-based, and an extreme range of regional readings that look like exceptions until you trace the cause.
Primary vs secondary salinity
- Primary salinity is natural: it develops from geology, climate, and groundwater patterns without human help, and it explains why parts of Australia have extensive naturally saline soils (FAO Soils Portal, UN food and agriculture agency).
- Secondary salinity is human-driven, most often from irrigation that raises water tables and leaves salts behind as water evaporates.
- The FAO Soils Portal classifies salt-affected soils as saline, saline-sodic, or sodic, depending on salt quantity, salt type, sodium content, and soil alkalinity (FAO Soils Portal, UN food and agriculture agency).
Ocean salinity vs soil salinity
- Ocean salinity is measured in PSU or ‰ and sits near 35 for the open ocean.
- Soil salinity is measured as electrical conductivity in dS/m; the scale runs from nonsaline (0–2 dS/m) to strongly saline (above 16 dS/m) (Utah State University Extension, agricultural research unit).
The gap between the two environments is enormous. Typical seawater at 35‰ is roughly 70 times saltier than the 500 mg/L threshold usually treated as the upper limit for fresh drinking water (FAO Water Quality for Agriculture, UN guidance).
Regional sea salinity examples
- Dead Sea: roughly 340‰; Red Sea: about 40‰; Mediterranean: about 38‰ — all three exceed the open-ocean average because evaporation concentrates salts (NOAA National Ocean Service, U.S. ocean agency).
- Baltic Sea: as low as about 7‰, kept brackish by heavy river inflow (NOAA National Ocean Service, U.S. ocean agency).
The pattern worth remembering: “salinity” is a spectrum, and the label changes depending on whether you are standing on a ship, a riverbank, or a farm.
What is a good salinity level for soil and how is it managed?
For most crops, the target zone is 0–2 dS/m. Utah State University Extension classifies soil extracts in that range as nonsaline and suitable for most crops, and it treats readings above 16 dS/m as strongly saline and generally unsuitable for crops (Utah State University Extension, agricultural research unit).
What is a good salinity level for soil?
- 0–2 dS/m: nonsaline, suitable for most crops.
- 2–4 dS/m: very slightly saline.
- 4–6 dS/m: slightly saline.
Six classes, one boundary worth memorizing: the climb from 2 to 16 dS/m is the difference between healthy yields and fields that will not grow most crops (Utah State University Extension, agricultural research unit).
| System | Class | Meaning |
|---|---|---|
| Soil EC | 0–2 dS/m | Nonsaline; suitable for most crops (Utah State University Extension, agricultural research unit) |
| Soil EC | 2–4 dS/m | Very slightly saline |
| Soil EC | 4–6 dS/m | Slightly saline |
| Soil EC | 8–16 dS/m | Moderately saline; generally unsuitable for crops (Utah State University Extension, agricultural research unit) |
| Soil EC | Above 16 dS/m | Strongly saline; generally unsuitable for crops (Utah State University Extension, agricultural research unit) |
| Salt-affected class | Saline | Excess soluble salts define the problem (FAO Soils Portal, UN food and agriculture agency) |
| Salt-affected class | Saline-sodic | Excess salts plus high sodium content |
| Salt-affected class | Sodic | Sodium and alkalinity dominate |
Leaching without drainage moves salt down, not out. For a grower, that means a salty water table can push the salts right back into the root zone within one irrigation season (FAO Water Quality for Agriculture, UN guidance).
What are 5 methods to manage salinity soils?
- Leaching: apply water beyond the crop’s evapotranspiration need so a net amount passes through the root zone (FAO Soils Portal, UN food and agriculture agency).
- Drainage: install or maintain drainage so leached salts actually leave the field; FAO water-quality guidance is blunt that leaching alone does not fix the problem (FAO Water Quality for Agriculture, UN guidance).
- Salt-tolerant crops: choose species and varieties that hold up at higher EC levels.
- Organic amendments: improve soil structure and help water move through the root zone.
- Gypsum: a practical tool on sodic soils, where sodium needs to be displaced before salts can be leached away.
The order matters as much as the methods. Drainage comes first; leaching then flushes the salt somewhere it will not return; crops and amendments buy resilience while the system stabilizes.
What reduces soil salinity?
- Rainfall and good-quality irrigation water dilute the salt in the root zone.
- Well-drained soils allow the diluted salt to move downward and out of the root zone.
- Salt-tolerant plants keep the ground covered and draw down shallow water tables.
The catch is timing. Salt control is not a one-off fix: every irrigation event adds a little more salt, so monitoring and drainage have to operate every season, not just during a crisis.
Which crop is most tolerant to salinity?
Barley sits at the top of the salt-tolerance list among grain crops. It can keep producing on soils that push most other cereals out of the field, which makes it the default answer for growers facing saline paddocks.
Salt-tolerant crops: barley, cotton, sugar beet
- Barley is among the most salt-tolerant cereal crops, with reported tolerance up to 10–12 dS/m.
- Cotton and sugar beet also rank high on salt-tolerance lists compared with other commodity crops.
By comparison, Utah State University Extension classifies soil above 16 dS/m as strongly saline and generally unsuitable for crops (Utah State University Extension, agricultural research unit).
What happens if soil salinity is too high?
- High salt pulls water against the plant: roots have to work harder to take up moisture, and nutrient balance is disturbed.
- Most crops begin to lose yield above roughly 4 dS/m (Utah State University Extension, agricultural research unit).
- Yield loss gets severe in the 8–16 dS/m range, which the same classification describes as generally unsuitable for crops.
Barley buys time, not immunity. Once soil EC climbs past the crop’s tolerance band, even salt-tolerant varieties face shrinking yields — so monitoring has to be continuous, not seasonal.
The consequence is slow and easy to underestimate: salt builds quietly in the root zone, leaves brown at the edges, yields shrink, and eventually a field can become unprofitable. In Australia, where naturally saline soils are widespread, choosing salt-tolerant crops is part of standard farm planning rather than a last-minute rescue.
Confirmed facts
- Average open-ocean salinity is about 35‰ (NOAA National Ocean Service, U.S. ocean agency).
- The Atlantic Ocean has the highest average surface salinity among the major oceans, near 36.5‰ (NOAA National Ocean Service, U.S. ocean agency).
- The Dead Sea is hyper-saline at roughly 340‰ (FAO Water Quality for Agriculture, UN guidance).
- Soils above 16 dS/m are classified as strongly saline and generally unsuitable for crops (Utah State University Extension, agricultural research unit).
What’s unclear
- Exactly how ocean salinity patterns will shift under climate change remains an active research area, not a settled forecast.
- Secondary soil salinization is highly site-specific: drainage, irrigation practice, and groundwater depth can turn a safe field saline within one season.
- PSU values keep confusing readers because they describe conductivity, not salt mass — a distinction the FAO Soils Portal (UN food and agriculture agency) flags.
- Crop tolerance to salt combined with waterlogging is less studied than salt tolerance alone, so local trials still outrank general guides.
- Regional salinity recommendations do not always transfer: the same irrigation schedule can behave differently on clay, sand, or peat (FAO Soils Portal, UN food and agriculture agency).
What the experts say
Evaporation removes water while leaving the salt behind, and sea-ice formation does the same on a seasonal cycle. These salinity differences create density differences that help drive the global ocean conveyor belt.
NOAA National Ocean Service, U.S. ocean agency
Drainage is the foundation of salt control in agricultural soils. Leaching alone cannot solve the problem if the salts have no way to leave the root zone.
FAO Soils Portal, UN food and agriculture agency
Soil salinity is assessed primarily through electrical conductivity, and the classification runs from nonsaline at 0–2 dS/m to strongly saline above 16 dS/m.
Utah State University Extension, agricultural research unit
These numbers point one direction: salinity is a management problem, not just a chemistry fact. For ocean researchers, salinity is a live signal of evaporation, rainfall, and melting ice. For growers — especially in Australia, where naturally saline soils are already widespread — the practical decision is clear: test soil electrical conductivity before planting, install drainage before salts accumulate, or watch yields shrink as the root zone turns against the crop.
Related reading: Everest Peak: Height, Cost, Deaths, and Climbing Rules Explained and Kilimanjaro Peak: Facts, Climbing Difficulty, K2 vs Everest.
openknowledge.fao.org, openknowledge.fao.org, fao.org, fao.org, link.springer.com
Frequently asked questions
What is salinity measured in?
Ocean salinity is measured in practical salinity units (PSU) or parts per thousand (‰); soil salinity is reported as electrical conductivity in deciSiemens per meter (dS/m). PSU is a conductivity-based scale rather than a direct mass measurement, according to the FAO Soils Portal (UN food and agriculture agency).
Why is the Dead Sea so salty?
The Dead Sea is a terminal lake: the Jordan River carries dissolved salts in, evaporation pulls water out, and there is no outlet for the salt to escape. That concentration process puts it near 340‰, roughly 10 times the open-ocean average (FAO Water Quality for Agriculture, UN guidance).
Can you drink sea water if diluted?
Diluting seawater lowers the salt concentration but does not make it drinkable on its own, and treatment is still needed. Standard guidance treats water above 500 mg/L of total dissolved solids as outside the fresh-drinking-water range, and ocean water averages about 35,000 mg/L — so it takes roughly 70-fold dilution just to approach that limit (FAO Water Quality for Agriculture, UN guidance).
How does salinity affect ocean currents?
Saltier water is denser, and that density difference helps drive the thermohaline circulation, sometimes called the global ocean conveyor belt. Water that becomes saltier through evaporation or sea-ice formation sinks and moves at depth, while surface currents carry fresher water to replace it (NOAA National Ocean Service, U.S. ocean agency).
What are the effects of high soil salinity on plants?
High salinity forces plant roots to work harder to take up water — osmotic stress — and it disturbs nutrient balance. Most crops begin losing yield above roughly 4 dS/m, and soils above 16 dS/m are classified as strongly saline and generally unsuitable for crops (Utah State University Extension, agricultural research unit).
Is the Mediterranean Sea saltier than the Atlantic?
Yes. The Mediterranean averages about 38‰, higher than the Atlantic’s roughly 36.5‰, because it is a semi-enclosed basin where evaporation removes water faster than rain and rivers replace it (NOAA National Ocean Service, U.S. ocean agency).
How does rainfall affect ocean salinity?
Rainfall adds freshwater to the surface and lowers salinity, while prolonged dry, hot spells do the reverse. NOAA National Ocean Service lists precipitation as one of the main controls on ocean salinity (NOAA National Ocean Service, U.S. ocean agency).
More related posts
 Frank Lloyd Wright: Biography, Masterpieces, Controversies
 Tanya Roberts: Death from sepsis, misreporting, estate
 Robbie Coltrane Cause of Death, Drinking, Estate Worth
 Sri Lanka vs Zimbabwe – Match Result, Scorecard and Analysis
 Michala Banas: Biography, Age, Nationality, Famous Roles
 Liam Delap: Age, Salary, Transfer News & Career Stats 2025
 Sonam Bajwa: Biography, Net Worth, Movies, and Personal Life
 Aaron Eckhart Biography: Movies, Net Worth, Career